If you have ever had the joy of skipping rocks on a lake (or just thrown a bunch of rocks in the lake because who seriously is good at skipping rocks?!), you have probably also noticed all the ripples that perpetuate across the water’s surface. As you will see carbon dioxide, greenhouse gases, global warming and finally climate change are related like those ripples in the water. Starting with carbon dioxide.
Carbon Dioxide
Carbon dioxide (CO2) is a naturally occurring gas. Plants take the gas in as a part of photosynthesis and animals breathe it out.
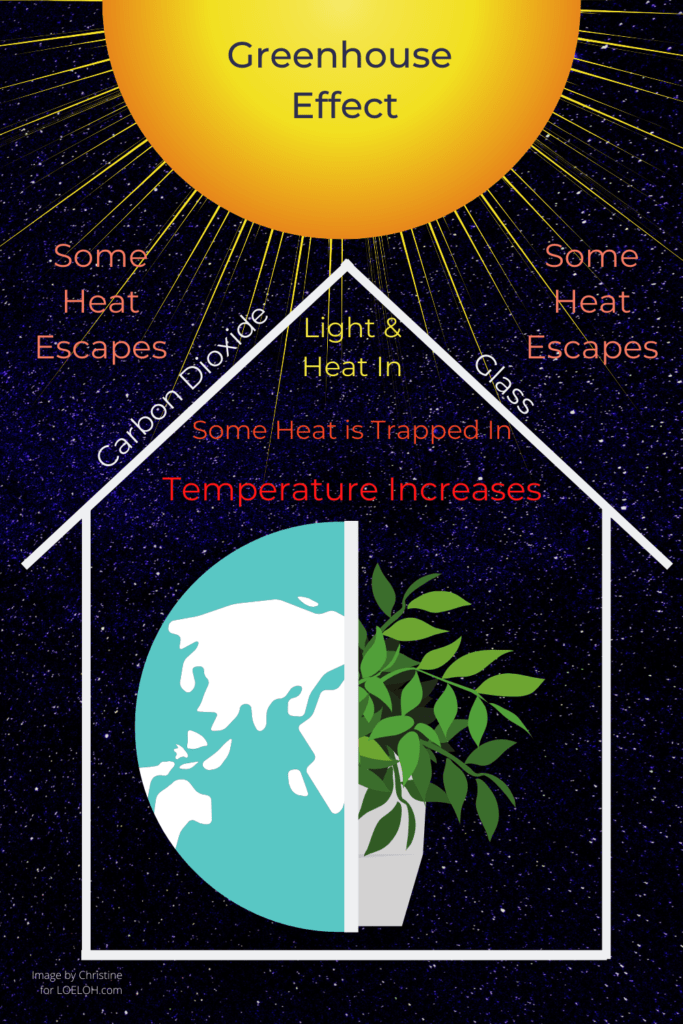
Carbon dioxide in the atmosphere allows sunlight through to the Earth’s surface, while holding in heat. Similar to glass in the walls and roof of a greenhouse, glass lets sunlight into the greenhouse but holds in heat. Thereby, increasing the temperature inside the greenhouse. This process of holding in heat by carbon dioxide is called the Greenhouse Effect. (1)
The Greenhouse Effect has allowed Earth’s temperatures to reach the point of sustaining life. Without this heat holding ability, Earth would be around 0 degrees Fahrenheit. (1) However, like most good things too much of it is not good.
If a greenhouse has multiple layers of glass stacked on top of each other, the greenhouse would be very warm but would still continue to allow sunlight through. Over the past 250 years, humans have burned concentrated carbon sources like coal and other fossil fuels. When these carbon sources are burned it emits carbon dioxide. As carbon dioxide emissions have increased, the carbon dioxide levels in the atmosphere have gone up as well. Since about the 1950’s carbon dioxide emission rates have skyrocketed, with carbon dioxide levels in the atmosphere following suit. Current carbon dioxide levels are the highest they have been in 800,000 years! (2)
Other Greenhouse Gases
Unfortunately, carbon dioxide is NOT the only gas that contributes to the Greenhouse Effect. A Greenhouse Gas is a gas that is able to hold in heat and radiate it out. Other major greenhouse gases are covered below. These include, water vapor, methane (CH4), Nitrous Oxide (N2O), and fluorinated gases. The level of these gases have increased, mostly because of human activities. (3)
Global Warming Potential and Carbon Dioxide Equivalents
Before we review the different greenhouse gases let’s cover two terms Global Warming Potential (GWP) and Carbon Dioxide Equivalents (CO2eq).
Global Warming Potential (GWP) is a value of the gas’s ability to hold in heat and how long the gas lasts in the atmosphere, when compared to carbon dioxide. (4)
Carbon Dioxide Equivalents (CO2eq) is a calculation of the Global-warming potential (GWP) of a gas multiplied by the million metric tons of the same gas. The result of this is often abbreviated to MMTCDE or Million Metric Tons of Carbon Dioxide Equivalents. Carbon Dioxide equivalents are often used to describe the levels of greenhouse gases as a collective. Check out methane description below for an example of the CO2eq of Methane. (5)
Keep these two definitions in mind as we continue to review the other greenhouse gases. Let’s begin with the most abundant greenhouse gas, water vapor.
Water Vapor
Water vapor (H2O) is different than other greenhouse gases because the levels of water vapor in the air are not directly influenced by humans. As the temperature in the air and on the Earth’s surface increases, more water evaporates and turns into water vapor. As the water vapor builds up in the atmosphere it is able to hold in heat, radiating the heat back to the Earth’s surface. (3)
Methane
Methane (CH4) is a natural gas, like carbon dioxide. The levels of methane in the atmosphere are much lower than carbon dioxide. Also methane only lasts about 10 years in the atmosphere, while carbon dioxide can last hundreds of years. However, while methane is in the atmosphere it is much stronger in its global warming potential (GWP) than carbon dioxide. Methane’s global warming potential (GWP) is 25, meaning, methane is 25 times stronger than carbon dioxide. Below is the calculation of methane into carbon dioxide equivalents (CO2eq). (3,5)
Carbon Dioxide equivalents (CO2eq) of Methane and How to calculate the Carbon Dioxide equivalents:
1 milllion metric ton of methane multiplied by methane’s GWP of 25= 25 million metric tons of carbon dioxide equivalents.
Which means that 1 million metric tons of methane emissions is equal to 25 million metric tons of carbon dioxide emissions. This is why human sources of increased methane emissions like burning fossil fuels are important because of their global warming potential. (3)
Nitrous Oxide
Nitrous Oxide is also a natural gas, like methane and carbon dioxide. However, nitrous oxide levels have increased from human activities including use of fertilizers and burning fossil fuels. Nitrous oxide levels are much lower than carbon dioxide levels but nitrous oxide is 298 times stronger than carbon dioxide. (3, 5, 6)
Fluorinated gases
Fluorinated gases are man made gases that have several uses, including as coolants in refrigerators and air conditioners. The 3 fluorinated gases I will comment on are Chloroflurocarbons (CFCs), Hydrochloroflurocarbons (HCFCs), and Hydroflurocarbons (HFCs). Fortunately, Chloroflurocarbons (CFCs) and Hydrochloroflurocarbons (HCFCs) are being phased out of use because these gases destroy the protective ozone layer in the atmosphere. The synthetic replacement is Hydroflurocarbons (HFCs). Fortunately, the concentration of each of these gases is quite low in the atmosphere. Unfortunately, their Global Warming Potential can be significantly higher than Methane and Nitrous Oxide. (7)
Global Warming Potential (GWP) ranges for Fluorinated Gases
Chloroflurocarbons (CFCs): 4750-14,400 GWP (7)
Hydrochloroflurocarbons (HCFCs): 77-2310 GWP (7)
Hydroflurocarbons (HFCs): 124-14,800 GWP (7)
Greenhouse gas levels in the atmosphere
Below are graphs from the National Oceanic & Atmospheric Administration (NOAA) of the greenhouse gas levels in the atmosphere.
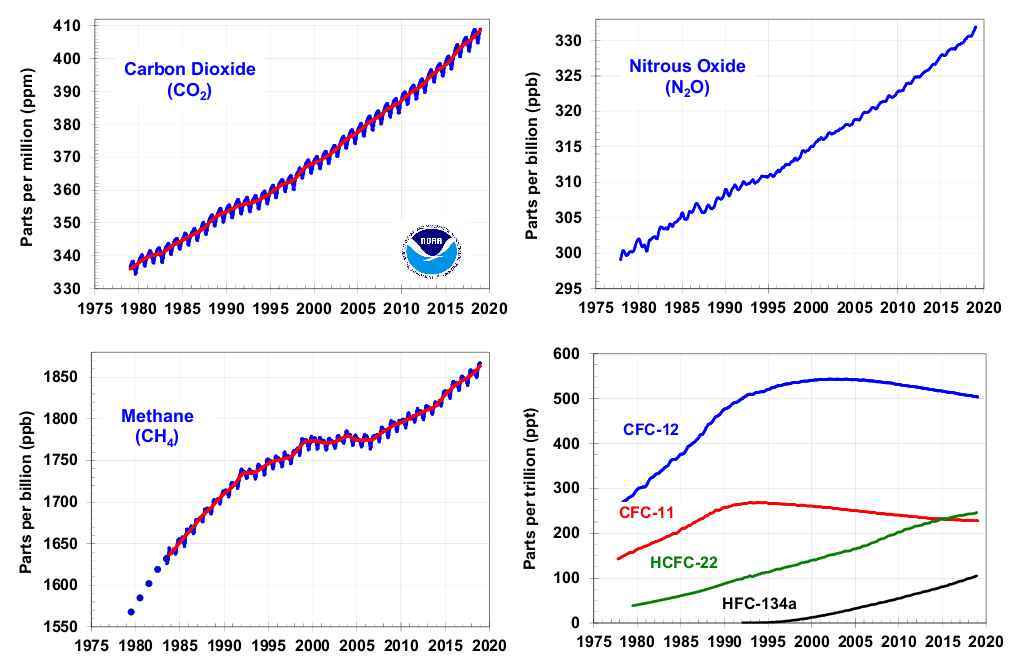
Of all the greenhouse gases, carbon dioxide is the main greenhouse gas emitted from human activities, accounting for over 80% of the emissions in the U.S. (11)
Global Warming
Global warming has been caused by the increased levels of carbon dioxide and other greenhouse gases holding in more heat. Global warming is defined as the “unusually rapid increase of Earth’s average surface temperature.” Surface temperature: refers to a temperature measurement taken if you or I were measuring the temperature of where we are located on the Earth’s surface. Like when we drop a pin on a map to tell a friend to meet us at that exact location, we are pinning a location on the Earth’s surface. (12)
NASA uses surface temperature readings from over 6000 different stations located all across the globe. They have found that Earth’s average surface temperature has increased an average of roughly 2 degrees Fahrenheit or about 1 degree Celsius in over the past 140 years. 2019 was the 2nd hottest year on record, only behind 2016. “Every decade since the 1960s clearly has been warmer than the one before,” said Gavin Schmidt, director of NASA’s Goddard Institute for Space Studies. (13, 14)
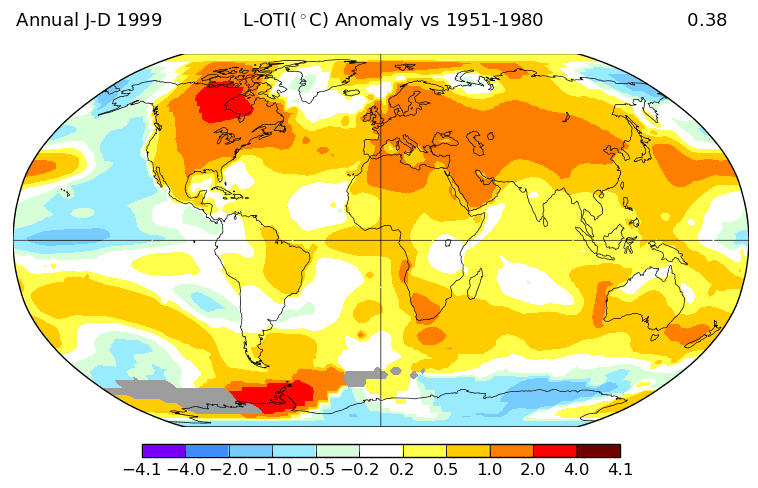
Changes in Earth’s Surface Temperatures from 1999 to 2019
Below are images of the changes in Earth’s average surface temperatures. The image on the left compares the average surface temperatures of 1999 to the average surface temperatures from 1951-1980. The image on the right compares the average surface temperatures of 2019 to the average surface temperatures from 1951-1980. The more orange and red that you see are areas where the temperature has gone up more. This is only 20 years of difference! In some areas, especially in the Arctic Circle and Antarctica, the average surface temperatures have increased between 2-5.2 degrees Celsius. In Fahrenheit, that is an increase in average surface temperature between 35.6-41.36 degrees Fahrenheit . (15)
Source: 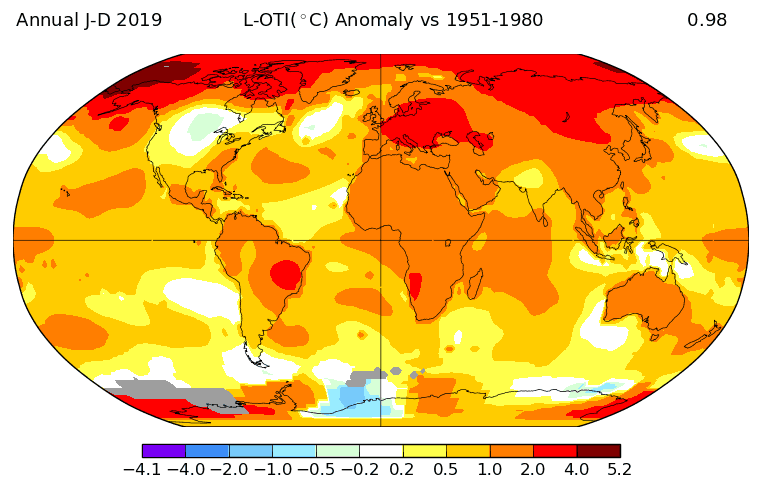
Parameters for Image on Left (Jan-Dec 1999): GHCNv4_ERSSTv5__1200km_Anom112_1999_1999_1951_1980_100__180_90_0__2_
Parameters for Image on Right (Jan-Dec 2019): GHCNv4_ERSSTv5__1200km_Anom112_2019_2019_1951_1980_100__180_90_0__2_
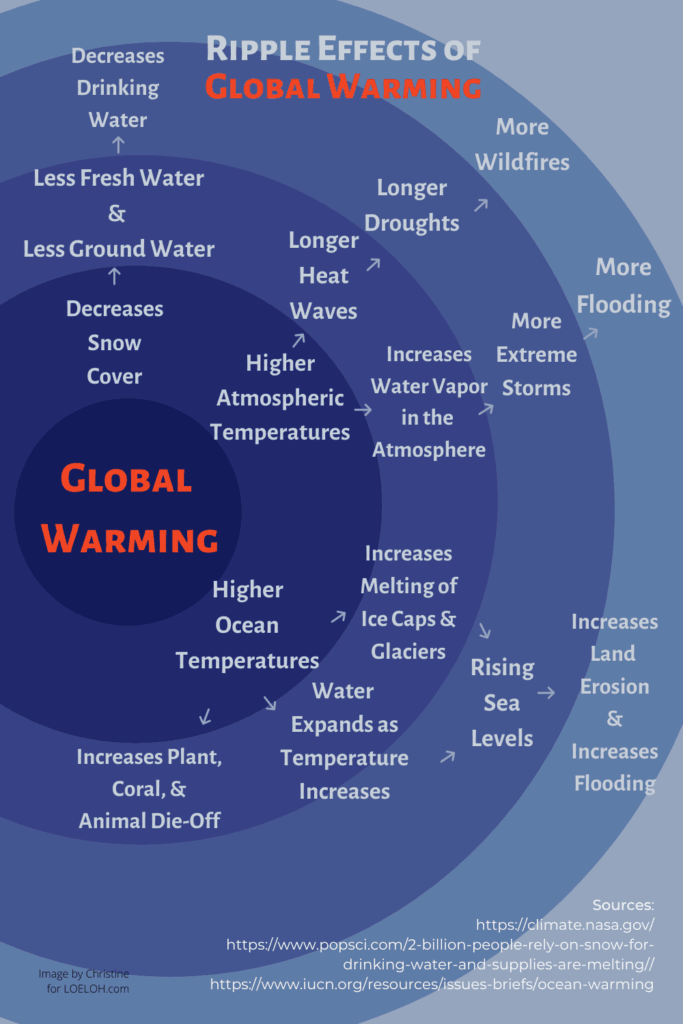
Effects of Global Warming
As carbon dioxide levels continue to rise and global warming worsens, they perpetuate ripple effects across the globe. The infographic maps only some of these effects. (16, 17, 18)
Climate Change
As global warming has persisted, usual weather patterns have had lasting changes. The lasting changes in weather patterns is climate change. (19) Climate change is happening all over the Earth. Climate change increases the likelihood of extreme weather events like (21)
- longer heat waves
- longer droughts
- more frequent wildfires
- more flooding.
Each part of the Earth has different climates from the bitter winters near the poles to the brutal heat near the equators and every climate in between. These different climate regions will experience climate change differently as well. That is why some of the effects are contradictory like wildfires and flooding. Unfortunately, as carbon dioxide and other greenhouse gas levels in our atmosphere increase, global warming will continue to get worse and so will the effects of climate change.
Let me clarify, climate change has occurred previously in Earth’s history but previous climate change events were from natural causes. Some of these natural causes include slight position changes between the Earth and the Sun, the solar output of the sun varies, and even from major volcanic eruptions. However, the climate change that is occurring now is from the extreme levels of carbon dioxide and other greenhouse gas emissions from human activities. (3, 20)
Goal: Reduce Carbon Dioxide Emissions
As PBS’s YouTube series called HotMess explained, even if we were to stop emitting any additional carbon dioxide tomorrow the Earth would still experience the effects of climate change for centuries. This is because carbon dioxide can exist in the atmosphere for hundreds of years. However, if we were to stop carbon dioxide emissions sooner we can keep some of the effects of climate change from worsening. We would also benefit from improved air and water quality. There are ways we can reduce our greenhouse gas emissions today. Ready to reduce your carbon dioxide emissions? Start here! (22)
Resources
1: Nye, B. (2016). Unstoppable. St Martins Press
2: Climate Change: Atmospheric Carbon Dioxide: NOAA Climate.gov. (2020, February 20). Retrieved from https://www.climate.gov/news-features/understanding-climate/climate-change-atmospheric-carbon-dioxide
3: Mann, M. and Selin, H. Global Warming. Encyclopaedia Britannica, Encyclopaedia Britannica, inc. (2020 March 16). Retrieved from https://www.britannica.com/science/global-warming
4: Glossary: Global-warming potential. Eurostat Statistics Explained (2014 December 11). Retrieved from https://ec.europa.eu/eurostat/statistics-explained/index.php?title=Glossary:Global-warming_potential_(GWP)
5: Glossary: Carbon dioxide equivalents, Eurostat Statistics Explained (2017 March 09). Retrieved from https://ec.europa.eu/eurostat/statistics-explained/index.php/Glossary:Carbon_dioxide_equivalent
6: The Causes of Climate Change, NASA.gov (2020, March 18). Retrieved from https://climate.nasa.gov/causes/
7: Refrigerants, Green Cooling Initiative. Retrieved from https://www.green-cooling-initiative.org/knowledge-center/technology/refrigerants/
8: The NOAA Annual Greenhouse Gas Index (AGGI), NOAA Earth System Research Laboratory, (2019) Retrieved from https://www.esrl.noaa.gov/gmd/aggi/aggi.html
9: Etheridge, D. M., Steele, L. P., Francey, R. J., & Langenfelds, R. L. (1998). Atmospheric methane between 1000 A.D. and present: Evidence of anthropogenic emissions and climatic variability. Journal of Geophysical Research: Atmospheres, 103(D13), 15979–15993. doi: 10.1029/98jd00923
10: Dlugokencky, E. J. (2005). Conversion of NOAA atmospheric dry air CH4mole fractions to a gravimetrically prepared standard scale. Journal of Geophysical Research, 110(D18). doi: 10.1029/2005jd006035
11: Carbon Dioxide Emissions, Greenhouse Gas Emissions. United States Environmental Protection Agency (2020 March 16) Retrieved from https://www.epa.gov/ghgemissions/overview-greenhouse-gases#carbon-dioxide
12: Global Warming,: Earth Observatory NASA.gov (2010 June 3). Retrieved from https://earthobservatory.nasa.gov/features/GlobalWarming/page2.php
13: New Studies Increase Confidence in NASA’s Measure of Earth’s Temperature, GISS NASA.gov (2019, May 23). Retrieved from www.giss.nasa.gov/research/news/20190523/
14: NASA, NOAA Analyses Reveal 2019 Second Warmest Year on Record, GISS NASA.gov (2020, January 15). Retrieved from https://www.giss.nasa.gov/research/news/20200115/
15: GISTEMP Team, 2019: GISS Surface Temperature Analysis (GISTEMP). NASA Goddard Institute for Space Studies. Dataset accessed 2020-02-12 at data.giss.nasa.gov/gistemp/.
16: The Effects of Climate Change, NASA.gov (2020, March 06). Retrieved from https://climate.nasa.gov/effects/
17: Two Billion People Rely On Snow For Drinking Water, And Supplies Are Melting: Popular Science popsci.com (2015, November 12). Retrieved from https://www.popsci.com/2-billion-people-rely-on-snow-for-drinking-water-and-supplies-are-melting/
18: Ocean Warming, Issues Brief, The International Union for Conservation of Nature IUCN.org (2017 November). Retrieved from https://www.iucn.org/resources/issues-briefs/ocean-warming
19: Overview: Weather, Global Warming, and Climate Change, Global Cimate Change NASA, (2020 March 18) Retrieved fromhttps://climate.nasa.gov/resources/global-warming-vs-climate-change/ 20: Scientific Consensus: Earth’s Climate is warming scientist consensus: Earth Observatory NASA.gov (Updated 2020, March 06). Retrieved from https://climate.nasa.gov/scientific-consensus/
21: The Link Between Extreme Weather and Climate Change, Hot Mess PBS. (2019, November 07) Retrieved from https://www.youtube.com/watch?v=5cY7fSbUWA8
22: Will Climate Change Stop If We Stop Emitting Carbon Tomorrow? Hot Mess PBS. (2018 August 30) Retrieved from https://www.youtube.com/watch?v=A4kX9xKGeEw